CHAPTER III
Results
Introduction
The subjects utilized in the study were bilingual education students who had undergone language testing in English and Spanish during three consecutive years, beginning in May 1982. All were students in the public schools of the city of Newark and were enrolled in the bilingual education program in three schools in the city: Roberto Clemente Elementary School, Elliott Street Elementary School and Franklin Elementary School. These schools are located in he same area of the city near its center, bordering east on the Passaic River and west on Ridgewood Avenue. The northern borders are on Centre Street and the souther section extends to Park Avenue.
Living Conditions
This area is mostly residential (downtown Newark is considered the commercial center of the city) and densely populated by Hispanics, most of whom are of Puerto Rican extraction. Standard family homes (two or three stories) and some multi-storied cement or wooden structures best describe the external characteristics of the residences. Six of the multi-floor cement or wooden structures appeared old and seriously deteriorated; two were rather modern and well maintained.
For the collection of family background data, parents were interviewed in their homes. Most, in fact, lived in formerly single-family homes which had been converted so that several families could inhabit them. Some families lived in apartments in large buildings. The family homes were, in most instances, old structures, but well maintained. It was particularly interesting to note how comfortable and well decorated they appeared. On the other hand, a small number of them were observed to be in seriously deteriorated condition.
However this cannot be said of the large structures. Six of these buildings left the impression (by looking at them from the outside) of abandonment and seemed practically uninhabitable. Once inside these apartments (many of them too small for the size of the family residing in them) an appearance of comfort and even luxury was observed. The quality of the living room equipment as well as the electronic components (television, stereo equipment, etc) were good.
Ethnic Characteristics of the Population
Children of Puerto Rican extraction comprised 88 percent of the sample, the majority of whom had been born and had lived on the mainland most of their lives. Among these children parental cross-cultural marriages were reported only with other members of the Hispanic community, not with Anglos or others. Tables 4 and 5 below provide statistics about the ethnic composition of the sample.
TABLE 4
TABLE 4
FREQUENCY COUNT OF FATHERS AND MOTHERS BY PLACE OF BIRTH

TABLE 5
PERCENT VALUES OF PARENTS BY PLACE OF BIRTH

The average time the subjects of the study lived in Puerto Rico was reported to be 10 months. The frequency of the subjects’ visits to the homeland was also recorded during the home interview with the subjects’ parents. These visits average 1.2 times during the child’s lifetime and visits ranged from zero times to a maximum of three. These measures did not correlate significantly with any of the language measures registered in the study.
Parents’ Jobs
Reported job placement for the subjects’ fathers is mostly in salaried positions where manual skills are required. These comprised about 50 percent of the sample. Jobs ranged from truck or automobile (taxi) driving to waiting on tables in a restaurant, or cooking, to operation a machine in a factory or performing supervised carpentry jobs or maintenance operations in factories or buildings. Some were either registered as unemployed or their employment status was unknown (in cases where the subject’s father did not live in the house). These made up about 30 percent of the sample.
Other job positions were distributed among unskilled labor such as car wash or servicing gasoline in a station. Two of the fathers were reported deceased, one by means other than natural.Some held leading positions on their jobs. One reported beinga foreman in a factory, another worked as a salesman and two owned or managed bodegas.
Among the mothers, the large majority, about 70 percent, reported remainingat home. Many indicated having difficulty finding jobs. Their scant knowledge of English was considered by many to be the cause of their unemployment. One observed routine occupation of the mothers was going to the school area three times a day, wether to provide extra food (during lunch hours) for their children or to bring them to and from school. Other mother worked in factories (7 percent). One mother did no live with her daughter. The grandmother had been the child’s caretaker since infancy. One mother worked as a secretary, and one was a nursing student.
Parents’ income (Appendix VII)
The average reported annual income for the sample was slightly below $8,000.00 (March 1984). On the other hand, 72 percent of the sample was reported to be receiving welfare benefits at the time.
There is a negative correlation of - .50 between yearly income and reported welfare. This means that most families whose husband and /or wife reported being employed, were not receiving welfare benefits. Only 37 percent of the sample reported earnings over $5,000.00.
Socioeconomic Status
The large majority of the families of the children under study share either low or average socioeconomic status levels. Accordingly, most depend heavily on the government for economic support, live in rented apartments, have no ownership status (a minority own an automobile), and their education is at or below the seventh grade level.
A lower class definition adopted by Albizu-Miranda & Marty-Torres (1958) in a study of the personality of the lower class Puerto Rican most closely describes the socioeconomic condition the the subjects of the study. Lower class for the is that segment of society which derives subsistence from manual labor (as distinct from white collar jobs), has not cmpleted sixth grade or seventh grade, and resides in areas characterized by deterioration and instability. The subjects of this study, in slight contrast with those of Albizu-Miranda & Marty-Torres (1958) may evidence somewhat better housing conditions, job status as well as academic level. This difference may be a attributed to the increased existence of welfare services and study grants which might have benefited this segment of society during the last twenty years.
TABLE 6
STATISTICS OF INCOME AND WELFARE DATA OF PARENTS OF SUBJECTS

Parents’ Academic level
Usually, both parents claimed adequate writing and reading skills in Spanish, i.e., that both reported reading at least the paper frequently as well as writing letters to relatives, etc. These skills are presumed to be adequate for ordinary communication purposes in this community.
On the average, fathers claimed better English skills than mothers, However, both claimed fewer reading and writing skills in English, meaning that both reported rarely using thse skills. It may be presume, also, that their poor performance in English may seriously delay any attempt to acculturate.
Both the fathers and the mothers reached an average seventh or eight grade level of schooling (See Appendix VII for details).
TABLE 7
ACADEMIC LANGUAGE SKILLS OF FATHERS AND MOTHERS OF
SAMPLE SUBJECTS AND EDUCATION IN NUMBER OF YEARS IN SCHOOL

Note: The academic skills of parents were rated in the following manner:
0 = No reading or writing skills in L1 or L2
1 = Some reading and writing skills in L1 or L2
2 = Adequate reading and writing skills in L1 or L2
3 = Excellent reading skills in L1 or L2
The Schools
The three receiving schools studied, all of them bilingual schools with bilingual classrooms, enroll Hispanic children, initially most of whom follow the bilingual education curriculum. Others are mainstreamed into the regular all English program. Children in the bilingual program follow all courses in Spanish; however , due to the linguistically mixed composition of students at this level, teachers were observed switching to oral English when giving instructions. This was done for the benefit of students who appeared to have difficulty understanding standard oral Spanish. Additionally, these children may be provided with remediate basic skills in English and must attend an ESL class during a regular daily school period extending for about an hour.
Children in the regular monolingual program remain in the same school, but follow an all English program. Most teachers in this program are native speakers of English and the majority are Anglos.
Guided by several criteria, children from the bilingual curriculum are subsequently mainstreamed into the all English program in the same school. Their score in the LAB or LAB-82 test in English, teachers progress evaluations, and parental consultation are used by ESL personnel in the school to allow transfer into the regular program. The Newark school system counts approximately five thousand Spanish speaking LEP students. About one thousand Spanish speaking students were enrolled in that language in first grade in the school system and seven hundred ninety one were classified as limited in English proficiency in December 1981 (Maculaitis, 1982).
Seventy-five subjects comprised the full student sample from which data was obtained. Scores on the Comprehensive Tests of Basic Skills (CTBS), Spanish version, administered in 1982 served as the grouping variable. Normal curve equivalent scores of the English proficiency test were organized into two groups by dividing the scores at the median. The higher scores comprised the high proficient group; the lower scores, the low proficient group.
A t Test was performed between the two groups on the dependent variable, that is English proficiency. Three English proficiency scores across low and high Spanish proficiency were compared in 1982, 1983 and 1984. This allowed for the comparison of two means for each of three years.
Outcome
The results of the test are shown in tables 8, 9 and 10. These better provide t test statistics for each one of the three pairs of groups under study. Table 11 provides a summary of mean scores for the three pairs, thus allowing for a visual inspection of the pattern observed. The analysis of covariance detailed below compare the composite means for each of the groups: 1982, 1983 and 1984.
TABLE 8
t TEST STATISTIC FOR L2 SCORES OBTAINED IN MAY, 1982


TABLE 9
t STATISTIC FOR L2 SCORES OBTAINED IN MAY, 1983

TABLE 10
t TEST STATISTICS FOR L2 SCORES OBTAINED IN FEBRUARY, 1984
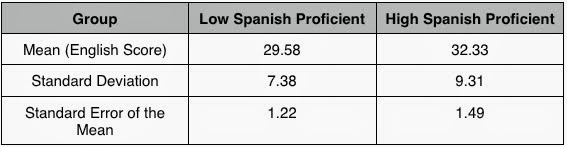

TABLE 11
t TEST - MEAN VALUES ON SINGLE VARIABLES FOR
ENGLISH PROFICIENCY IN 1982, 1983 AND 1984

Children who yielded high scores in Spanish (the high Spanish proficient group) on the average, also scored higher on English proficiency tests. On the other hand, children wth low proficiency scores in Spanish also yielded poor scores on the English proficiency tests, thus confirming Cummins’ hypothesis.
The following table (Table 12) provides a full display for the total sample on hree consecutive years. This table summarises data and allows observations of the decreasing yield in language proficiency (Spanish and English) across time. The significance of this profile will be reviewed below.
TABLE 12
MEANS AND STANDARD DEVIATIONS OF FIVE LANGUAGE VARIABLES

Analysis of Covariance
Statistical Design
Scores obtained for the full sample on the CTBS Espanol 1982 serve as criterion for the grouping variable. Students who scored below the median on this est belonged to the low Spanish proficient group. Students who scored above the median belong to the high Spanish proficiency group. English proficiency scores of the same sample (repeated measures) in 1982, 1983 and 1984 comprised the dependent variables for the high Spanish and low Spanish groups. Spanish proficiency (low and high) and year (1982, 1983 and 1984) are the independent variables or factors. Full I scores of the Spanish version of the WISC are covaried with the dependent variables to permit adjustments of the cell means , if necessary, on account of the influence of intelligence, and independent variable in this case. A two-way analysis of covariance will result.
The design used is a repeated measure model. Repeated measurements are made of the same variable for each subject at different times under different conditions. A factor classifies the subjects into two groups (grouping factor), according to Spanish proficiency. There is a second factor for which each subject is measured at all levels (within subjects factor), time of measurement (year), from 1982 to 1984. The covariate, intelligence quotient (IQ) is treated as an independent factor. In addition, it is assumed to be linearly related to the dependent variable, English proficiency, and it remains constant across the level of the within factor. Presumably IQ did not change significantly throughout the three years data was collected for the subject of the sample.
Outcomes
The mean IQ for the Spanish low group was 93.4 and for the Spanish high group it was 96.74, a difference of only 3.1 points. The following tables provide cell means and standard deviations for the dependent variable without and with adjustments on the cells to account for the effect of the covariate.
TABLE 13
ENGLISH LANGUAGE PROFICIENCY MEANS AND STANDARD DEVIATIONS FOR THREE CONSECUTIVE YEARS WITH NO CELL ADJUSTMENTS

Note: LSP= Low Spanish proficient and HSP = High Spanish Proficient
TABLE 14
TABLE 14
ENGLISH LANGUAGE PROFICIENCY MEANS FOR THREE CONSECUTIVE YEARS WITH CELL ADJUSTMENTS

TABLE 15
CRITICAL F AND TAIL PROBABILITY FOR GROUP (HIGH VS. LOW PROFICIENCY), IQ, YEAR AND INTERACTION

Main Effects
1. Level of Proficiency (grouping variable).
There were observed significant mean differences in English between the high and the low Spanish proficiency groups. English language scores were higher for the high Spanish proficiency group and lower for the low Spanish proficiency group. Intelligence, a factor estimated to be a potential source of variance across groups, did not produce significant levels of change to account for the group differences in proficiency level. Therefore, Cummins’ hypothesis is most convincingly supported by this specific linguistic interdependence profile.
2. Year
Contrary to expectations, English language competence significantly decreased from year to year. This general trend may seem to run in contradiction to Cummins’ hypothesis. It would be expected that subjects whose Spanish proficiency was higher would be equipped with adequate first language skills (over the threshold level) to influence on a competent development of the second language, thus preventing the observed downward trend.
However, further analysis of the data on Spanish development indicates that first language skills did not, in fact increase from one year to the next. (1982-83), but diminished (see Table 12). Cummins’ hypothesis assumes that first language skills must be maintained or allowed to grow at competence levels. This not being the case, the expected result would then be consonant with the data provided in table 12, indicating a downward yield in English proficiency mean scores for the high Spanish proficient group across time. This pattern is not a discomfirmation of Cummins’s hypothesis; instead, it provides support for it.
3. A by B (Year by Group)
A significant interaction was observed, but counter to expectations. It was estimated that the high Spanish proficient group would differentially increase its English competence across time as compared to the low Spanish proficient group. On the contrary, the high Spanish proficient group deteriorated most rapidly than the low Spanish proficient group.
This is explained by the fact that the high Spanish proficient group did not maintain or improve its Spanish proficiency level. In fact, it diminished in Spanish competence. The low group did not diminish its English competence as intensely as the high group (although its Spanish competence also decreased equally) because it was poorer from the beginning. On the other hand, the high group did have sufficient levels of competence to allow for significant decrease.
Factor Analysis
A factor analysis was run with all the core variables, background variables and IQ scores. Background variables considered in this study are:
- Parents’ schooling
- Socioeconomic status
- Father’s presence or absence from the home
- The child’s bilingual language exposure
- The number of years he child lived in the old country
- The child’s academic grade point average
- Behavioral non academic variables
- The child’s intelligence quotient
Observations of associations between any of these variables and scond language scores, and/or existing patterns of intercorrelated variables in association with second language scores may yield a broader profile of a child’s linguistic and non-linguistic characteristics with the framework of second language competence, intelligence, an often intervening variable presumed to be significantly involved in changes on language proficiency scores is also included in the factor analysis.
In all, 16 independent variables were used in the Factor Analysis. These are the following:

A matrix was generated from the scores of each variable. Each variable was correlated with every other variable. This was factor analyzed to indicate which variables may be grouped together into a superordinate construct called “factor”.
A factor includes those variables which appear to be highly correlated among each other. This procedure will indicate whether English scores and Spanish scores belong to the same factor (bilingual proficiency), or separate factors. It will also indicate whether any of the other variables correlate with language proficiency, or if they form correlation clusters having little or no correlation with the language variables.
Outcomes
A correlation matrix generated by 75 cases and sixteen variables (see previous section) will be displayed below. Before the correlation table, a definition of each of the codes used in the table is presented.
TABLE 16
DESCRIPTION OF VARIABLE CODES OF THE
CORRELATION MATRIX

TABLE 17
CORRELATION MATRIX


An inspection of the correlation matrix reveals that the language variables (within and across languages) correlate highly with each other. A second important observation is that language variables measured across time likewise, correlated highly with each other. These in fact seem to indicate a correlational cluster or a factor. This single set of observations adds further evidence for Cummins’s hypothesis. The longitudinal dimension of linguistic interdependence, which seem to be the crux of Cummins hypothesis, brings to focus the developmental interdependence aspect of bilingual development.
Other variables, such as grades (academic and behavioral), verbal IQ and years living in homeland also form part of this factor. IQ and exposure to homeland, however, seem to play a secondary role within the correlational cluster. The fact that grades (academic and behavioral) correlate rather strongly with language is rather obvious. Grades may probably be consequential to language proficiency. Academic evaluations at this early stage of school rely heavily on language proficiency.
A varimax orthogonal rotation was performed on the variables to yield six factors arranged in patterns called sorted rotated factor loadings. Table 18 displays the sorted rotated factor loadings for the sixteen variables given above.
TABLE 18

TABLE 18
SORTED ROTATED FACTOR LOADINGS (PATTERN)
The above factor loading matrix has been rearranged so that the columns appear in decreasing order of variance so that for each successive factor, loadings greater than .5 appear first, loadings less than .25 have been replaced by zero.
The first factor described in Table 18 assigns high loadings to the following variables: Spanish-82, and Students’ Academic Grades. English-83 and English-84 are also included. However, these do not load as highly as Spanish. The students’ Academic behavioral ratings and their verbal intelligence quotient also load on this factor, but their ranking is low.
Table 19 displays descriptive statistics for each of the sixteen variables under study:
TABLE 19
MEANS, STANDARD DEVIATIONS, SMALLEST AND LARGEST VALUES OF SIXTEEN VARIABLES

Tables 18 and 19 have provided, respectively, a factor analytical and descriptive statistical layout about the full set of variables under consideration. The following step will be to describe in as few words as possible the meaning for each of the 6 factors. The specific arrangement of the loadings of each of the 6 factors. The specific arrangement of the loadings of variables onto a factor may generate a meaningful construct which underlies the elements that make it up.
Factor description
This factor, Factor 1, may be called: Regressive Spanish-English Academic language interdependence. Spanish is the primary language of the students; therefore, it seems to prevail as the stronger of both languages, allowing for greater homogeneity (loadings are similarly high for the Spanish 82-83) from one year to another. The fact that English maintains a higher learning gradient (knowledge of English is limited for those children) explains the greater variance across time parameters for that language when compared with Spanish (see Table 18, Factor 1).
It was also observed that, these children's’ language scores decreased in value from year to year. For this reason a regressive interdependence has developed between the languages, one apparently leading the other downward.
Factor 2 may be properly called: Regressive Oral Academic English Proficiency.
This factor, (see Table 18 Factor 2), assigns high factor loadings to the three English variables (English 82-83-84) and the number o ears the child lived in his homeland. This latter variable however, loads negatively. This means that a negative correlation exists between the number of ears the subjects lived in the homeland and their proficiency in English: the less time spent in their land of origin (a Spanish ambience), the greater the proficiency in English.
This pattern allowed for these variables, English-82-83-84 and time spend on homeland, to load on one single factor. It may therefore be affirmed that as the number of years the subjects lived in their homeland decreases, the greater the homogeneity of yield in English from one year to the next. However, it must be observed that these children diminished in English proficiency from one year to another. This may further mean that whatever more the child learned of English in the home and neighborhood (due to having lived longer in the mainland) correlates with his already observed diminished English proficiency across time.
Factor 3 (see Table 18) demonstrates inversely related factor loadings for oral language exposure. It simply states that time exposure to Spanish and English was shared complementarily. The more time the child either actively or passively engaged in one language, the less he or she spent on the other. This measure was arbitrarily designed to create this specific effect; therefore, it provides no additional information. It is then omitted as a significant factor in this study.
Factor 4 (see Table 18) may be called Socioeconomic Status. It assigns high factor loadings to socioeconomic variables. These are socioeconomic status and mothers’ and fathers’ education level. These three variables in fact belong to the one factor. Socioeconomic status was established or defined here as a composite of both parents’ education level in addition to income. Therefore having them together in one factor simply confirms the socioeconomic status variable computations which attributes considerable weight to education. Furthermore, parents’ education seems to correlate with income, employment status, ownership and housing level variables (see appendix I).
Factor 5 may be called: Father-Child Dependency and School-performance. It involves the following variables in order of decreasing weight.
- Father’s presence in the household (.82)
- Students’ behavioral evaluations (.69)
- Students academic evaluations (.49)
- Socioeconomic status (.26)
- Performance intelligence (.26)
- Mothers’ education (-26)
This factor clusters three primary variables: the fathers’ presence in the household, the students’ discipline in school and academic grades (see Appendix II). These correlations reveal how significant the role of the father may be to the overall performance of the child in school. On the other hand it failed to underscore the role of the parents’ education level, especially that of the mother, to the child’s overall academic performance. In this respect, it runs contrary to expectations.
The sixth and last factor may be called intelligence. It loads highly on both performance and verbal intelligence. This observation affirms that performance intelligence and verbal intelligence belong to one single factor. This fact simply affirms what the Intelligence test (WISC) proposes to measure, one single factor, that is intelligence. No additional information is added by this factor other than what has been previously ascertained by intelligence tests designers.
Multiple Linear Regression Analysis
In order to determine the contribution of the variables under study on the variance of the independent variable, English proficiency in 1984, a multiple regression analysis has been designed.
The first goal is to observe the regression of Y (English proficiency 1984) on X1, X2....(15 independent variables). A multiple regression coefficient (R) was generated. The value of the coefficient R will indicate whether this correlation is significant.
The multiple regression coefficient (R) will be squared to provide information about how much of the variance of Y (the dependent variable, English 84) is accounted for by the variance of the combined independent variables. Results of the Multiple Regression Analysis are shown in table 20:
TABLE 20
MULTIPLE R, MULTIPLE R-SQUARE AND ANALYSIS OF VARIANCE
TABLE 20
MULTIPLE R, MULTIPLE R-SQUARE AND ANALYSIS OF VARIANCE

Table 20 provides vital information about the combined effect of all independent variables on the variance of the dependent variable, English 84. The coefficient of multiple correlation (which is interpreted much like an ordinary coefficient of correlation), R, is a descriptor of this concept. The coefficient (R) is .75, which is high. It means that the values of the dependent variable can be rather accurately accounted for by the combined variances of the independent variables. However, it remains to be observed which variables specifically account for such an effect as well as how strongly each of the relevant independent variables affects the dependent variable.
A second value, that of R-Square, also provides information about the magnitude of the relation. This is .56, which means that approximately 56 percent of the variance of English-84 is accounted for by the independent variables in combination.
The F ratio of 4.94 tells us that the regression 6f English-84 on the independent variables is statistically significant (p=00). The probability of an F ratio this large occurring by chance is less than .01.
Because many of the variables in the study intercorrelate, or are unrelated to the dependent variable, it is possible to select from a pool of variables a smaller set, which will yield an R-Square almost equal in magnitude to the one obtained by using the total set of variables. Three methods are used below to attain this purpose. These are forward and backward stepping and stepwise regression.
Forward stepping is the first method used. At each step the variable with the highest F-to-enter value is included in the equation. The stepping stops when no variable has an F-to-enter value greater than 4. The correlations of all the independent variables with the dependent variable are, therefore, calculated. The independent variable that has the highest correlation with the dependent variable is entered first into the analysis.
Tables 21 through 25 presents the five steps which comprised the forward stepping procedure of regression analysis.


TABLE 25
This specific pattern shows that socioeconomic status and verbal intelligence contribute insignificantly to the variance of the dependent variable. English-82 and 83, and school behavior appear to be the three most contributing variables. These seem to be the crucial predicting English proficiency in 1984. Fifty percent of the value yielded by the subjects con be attributed to the influence of previous knowledge of English in conjunction with a second variable, discipline in school (school behavior).
Backward Stepping follows forward stepping. It begins with the squared multiple correlation of all independent variables with the dependent variables. Each independent variable is deleted from the regression equation on at a time, and the loss to R-Square due to the deletion of the variable is studied.
TABLE 27
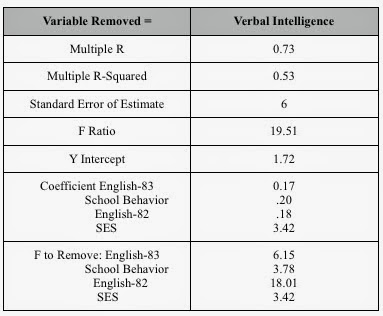

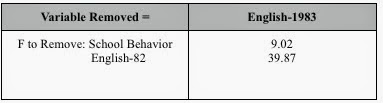
TABLE 27
BACKWARD STEPPING : STEP 1


Table 32 (Summary of Forward and Backward Stepping) demonstrates that English-82 contributes meaningfully (39 Percent) to the variance of English-84. English-83, however, is less meaningful in its contributory effect (5 percent). Both exhibit significant F limits at the .05 level (F greater than 3.98). The diminishing effect of English-83 on the dependent variable is expolained only on account of the fact that it correlates highly with English-82, therefore, its contribution is redundant. Only its residual effect is computed in the stepwise analysis of regression.
A non-linguistic variable, the child’s behavioral school grades (personality and citizenship development) also appears as exercising influence over English-84 (7 percent). In addition, it yielded a significant F at the .05 level (9.02). This variable includes the following conducts:
1. Social and Emotional Development
2. Work Habits
3. Health and Safety Habits
It seems logical that this variable contribute to the learning of a language. What appears to be unexpected is that it contributes so little to learning. This relatively low value may make sense in the context of the poor language learning rate evidenced by all the subjects of the study. If the curriculum does not foster significant progress of English, classroom discipline may be of little help.
Other variables included in the stepwise regression analysis such as socioeconomic stutus (1 percent) and verbal IQ (2 percent) contribute minimally and its F values are not significant at the .05 level. Socioeconomic status is a rather homogeneous variable. Most of the parents of the subjects of the study share similar socioeconomic status levels seen in the following context, Puerto Ricans made up the totality of the sample (with only 3 exceptions). None went to college, none held jobs equivalent to middle class income levels or middle class job status levels ($20, 000 or more; white collar) All but one rented apartments (one owned a house). None were able to send their children to private schools; all lived in a poor area of the city almost exclusively inhabited by Hispanics.
A homogeneous variable such as socioeconomic status, for this sample, would not explain variance. It would, in any case, predict low academic yield if this group were compared with a higher socioeconomic status group, if all other variables remain equal.
Verbal IQ has very low predictive value for this sample. It is unexpected in the context of the numerous studies which positively correlate intelligence withe linguistic development. However, intelligence may exercise secondary influence to language learning in primary school when the curriculum is no designed to generate progressive or maintenance bilingualism. A similar conclusion was reached by Lambert (1977). He relates such findings with subtractive bilingualism, the product of submersion programs where students are surrounded by negative attitudes and do not live in a learning environment that induces learning.
No hay comentarios:
Publicar un comentario